|
St Francis |
|

|
CSY |
|

Sat2Chart - Making Satellite Charts for Navigation
Last Updated:
05/08/2026
Download the Latest Version of Sat2Chart v19.0.2.4
Change Log
Download Windows Installer Exe
Download as Zip file
Paul's Download
Folder
Sat2Chart Youtube Channel
Version v19.0.2.4 has new Landsat capability! Youtube Tutorial
If making Charts from Landsat, you need ImageMagick
Having trouble getting disconnected while downloading? Try NordVPN_Rotate (requires NordVPN, and special settings in NordVPN). See the Tutorial on this on YouTube. More about NordVPN.
Download a Compatible Version of
SAS.Planet (new v250505.10764 Stable)
How to
Update Sas.Planet on your system: Sas.Planet Update Readme
Note: Sat2Chart will run easily with most older
or newer versions of SAS.Planet, but advanced features like Multi-Map
support may not work, and the map definition files, which change frequently,
may be incompatible.
| Sat2Chart is free, but please occasionally donate to Paul Higgins, the author, to thank him for the thousands of hours of work he put into (and continues to put into) developing this powerful tool. Thank Paul Higgins (Paypal) |
Installation Instructions, for a New Install of Sat2Chart
The following prerequistes are required to run
Sat2Chart:
1. Windows
Sat2Chart only runs
on Windows 7, Windows 8, Windows 10, Windows 11.
Note: It can be run on
MacOSX >= V10.5 or Linux/Gtk >= V2.6 if running Windows in a virtual
machine.
2. Open Object Rexx - mandatory
Sat2Chart is written in REXX. You must install the 32bit version of Open
Object Rexx. The Sat2Chart-compatible version of ooRexx can be downloaded
from this link:
ooRexx
Other versions can be downloaded from
here, but
Sat2Chart has not been tested with these versions.
Important:
Before installing ooRexx use the Control Panel/Programs and Features to
uninstall any old or 64bit versions of ooRexx. Take all the defaults when
installing the new version.
Note: ONLY install the 32Bit version even if
you are running on a 64Bit system.
If it seems the system doesn't
recognize your installation of ooRex, reboot your computer and try again.
3. GDAL - required
GDAL is
required to create most charts. The version of GDAL that has been tested
with Sat2Chart is version 2.0.4 (aka GDAL 204). The Geospatial Data
Abstraction Library (GDAL) is an Open Source software library for reading
and writing raster and vector geospatial data formats. It includes a
collection of tools for data conversion, processing, and analysis. It is
commonly used in geographic information systems (GIS) and remote sensing
applications. GDAL is an open-source library. See the section below
Installing GDAL
4. Sas.Planet - recommended
Sat2Chart supports Sas.Planet from V14 and up. You can download the latest
Sat2Chart-supported copy of Sasplanet (v250505.10764 Stable) from here:
SAS.Planet Download This version is
pre-configured to work well with Sat2Chart.
After downloading, unzip to a directory eg:
C:\SasPlanet
then do the following:
Create a shortcut to the C:\SasPlanet\SasPlanet.exe and
start SasPlanet.
Start Sat2Chart and open the SasPlanet option tab.
Change the "SasPlanet Location:" field to
C:\SasPlanet
Alternatively, you can download the absolute latest version from one of the SAS.Planet developers, here: https://sasplanet.geojamal.com/ However, there are a number of configuration changes that need to be made to get Sat2Chart to interact correctly with SAS.Planet. See the "SasPlanet Support" section in the Help file installed with Sat2Chart.
Saving your existing SAS.Planet cache: We periodically update the SAS.Planet version to a newer one, to take advantage of new developments and/or new map definitions. If you want to retain a downloaded cache from your previous version of SAS.Planet, it can just be copied over to the new SAS.Planet folder (make sure cache folder names are the same name and type). See the Sas.Planet Update Readme file linked above for details on moving specific configuration files from an old version of SasPlanet to a new version.
5. Google Earth - optional
Sat2Chart supports only GoogleEarth Pro Version 7.3.3.7786 and above. You
can download GoogleEarth Pro installer from this website:
Google Earth Pro Download. More versions of GoogleEarth Pro
available
here.
6. QWERTY keyboard - mandatory
Because
there is no programming interface built into SAS.Planet, Sat2Chart actually
mimics keyboard commands to make SAS.Planet do it's thing (download
satellite data and produce mbtile charts). So the keyboard used on
your computer must be a QWERTY keyboard.
7. vcredist_x86 - Required for some Utilities
vcredist_x86 is a Microsoft installer for the Visual C++ Redistributable runtime, which includes dynamic-link library (DLL) files required by 32-bit applications built with Visual Studio.
Download from here and run the exe.
Without it, the "View Chart", "Edit Chart" and "List
Charts" utilities won't work.
If you run into problems getting set up
The most comprehensive discussion of installing and setting up Sat2Chart is on sv Ocelot's website, here: https://hackingfamily.com/Cruise_Info/Equipment/mbTiles.htm
Where to ask Questions?
GE2KAP/Sat2Chart Facebook Group
Sat2Chart Cruiser's Forum Discussion
In order to process GeoTiffs, quilted charts or edit
MBtiles charts you will need to install GDAL.
You can download the
Sat2Chart-compatible version of GDAL 204 from here:
GDAL Download
Other versions are available here:
https://gdal.org/en/stable/download.html#current-release
The current
version is 3.11, but there is no guarantee that it will play nicely with
Sat2Chart.
Note: If you have already installed GDAL, and it less than
version 204 then you must uninstall it first using the Control
Panel/Programs and Features before installing V204.
Use the "Typical"
install option.
Also Note: If you are using Mozilla Firefox: the file
may be downloaded and appear in the window as garbage. Press the "Open menu"
icon then "Save Page" and select a location to save the file and then
execute it from that location.
It is no longer necessary to update
the path variable with the GDAL location. If GDAL is installed, but the path
variable has not been updated with the GDAL location, Sat2Chart will
dynamically set it. But this is not permanent so if this is your first
install of GDAL, you should update the system path variable and add the
following entry for GDAL to the Windows path environment variable.
For 64 bit sytems you will add: ;C:\Program Files
(x86)\GDAL and for 32bit systems it will be: ;C:\Program Files\GDAL
see
the topic in the installed Help file: Adding a New Path Variable Entry.
To ensure that all running programs are aware of this new environment variable you should either sign out then sign back in or Restart Windows.
If you have updated the path variable, to see if GDAL
is installed OK open a new Command Prompt and enter: gdalinfo --version
The output should be: GDAL 2.4.0, released 2018/12/14
Easy Steps to Make Your Own Satellite Chart
Advanced Chart-Making Topics from sv Ocelot (also installation and setup tips).
There is also extensive help in Sat2Chart that is installed when you install the program. Click on the Help button on the main page.
Sat2Chart Support
GE2KAP/Sat2Chart Facebook Group
Sat2Chart Cruiser's Forum Discussion
About Sat2Chart

In about 2012, Paul Higgins, a cruiser from Canada, started playing with Google Earth and eventually made and released a program called GE2KAP. GE2KAP could miraculously create KAP charts, usable in many electronic navigation programs, from Google Earth satellite views. For people cruising in out-of-the-way places, where navigation charts are not maintained and may be wildly inaccurate in some places, this was revolutionary.
As the technology evolved, and as GoogleEarth evolved (in a bad way), Paul eventually found a better solution for the satellite viewing program-- a program called SAS.Planet. He revised GE2KAP to use SAS.Planet, and added the option to create mbtiles charts (providing much better color detail), and eventually released his new program as Sat2Chart.
About Satellite Charts
I suggest you review my presentation "Electronic Navigation Alternatives" if you do not already know why people are raving about KAP/mbtile satellite charts. Presentations Link
The Satellite chart pictures are in generally very VERY accurate--usually more accurate than even the latest available charts we have in the western Pacific island countries and much of SE Asia, and with substantially more detail, once you learn how to read the colors in a satellite chart.
However, we know of a least 3 real issues possible with
'home-made' charts.
1. Always always always do a cross reference
between known waypoints before you trust any of these home-made charts.
And always back up this new-fangled technology with 'Mark I Eyeballs'
2. Satellite views sometimes have remote reefs 'missing' or painted out. Not
sure why this is, but don't assume an empty expanse on a Satellite chart is really
empty. Try to find S Minerva Reef, Rose Atoll, and Fonua One One (Tonga, S
Vavau Group) on a GoogleEarth chart. So again, always be cross-referencing with a
regular chart when using these charts.
Note: If you are looking at a satellite view, and that view has clouds in it, or a low sun angle, or is "painted out", it is worth reviewing other satellite imagery sources.
Download the SASPlanet.zip file and unzip it and put the
unzipped folder on your C:\ drive (no "installer" needed). Make a
shortcut to SAS.Planet.exe and put that on your desktop or Start menu.
3. In areas with small patch reefs, I have noticed that sometimes clouds
form right over reeflets and small island. You think--"Oh, that's just a
cloud.", but there's a good possibility of something solid underneath that
cloud. (the reef warms the water and causes the small cloud, which obscures
the reef in the sat pic). Always be suspicious of clouds.
Sat2Chart is free, but please feel free to donate to Paul, if you want to thank him for the thousands of hours of work he put into developing this powerful tool. Thank Paul Higgins
 Paul and his dog, Whitey |
To use mbtiles with OpenCPN
1. Unzip the downloaded file to someplace where you can find
it again (My Documents\ or C:\Charts\ or whatever).
2. In the OpenCPN program, click the Gear Icon, and click the Charts Tab
3. Use the browse button to navigate to
the folder and click the add button. If you have your charts stored in
multiple folders under one "Charts" folder, just adding the Charts folder,
it will find and add all the sub-folders. (but you may not want to do this
if you have an extensive collection of charts. Adding individual subfolders
for the area you are currently cruising is a better practice).
For more details and lots more info on using OpenCPN, see our
presentation
we regularly give to other cruisers (free PDF download).
5. Click on the Add Selection button, and the folder, AND ALL SUB-FOLDERS will be added to the
'Active Chart Directories' box below. Do this for whatever charts you will
plan to use in the near future. If you end up with a multi-level
folder structure (ie "Micronesia" and then a folder for each zip file,
OpenCPN will find any chart in the tree, but Maxsea will only find the
charts in the one folder you point it to).
6. Click OK, and OpenCPN will rebuild its list with your new charts
included.
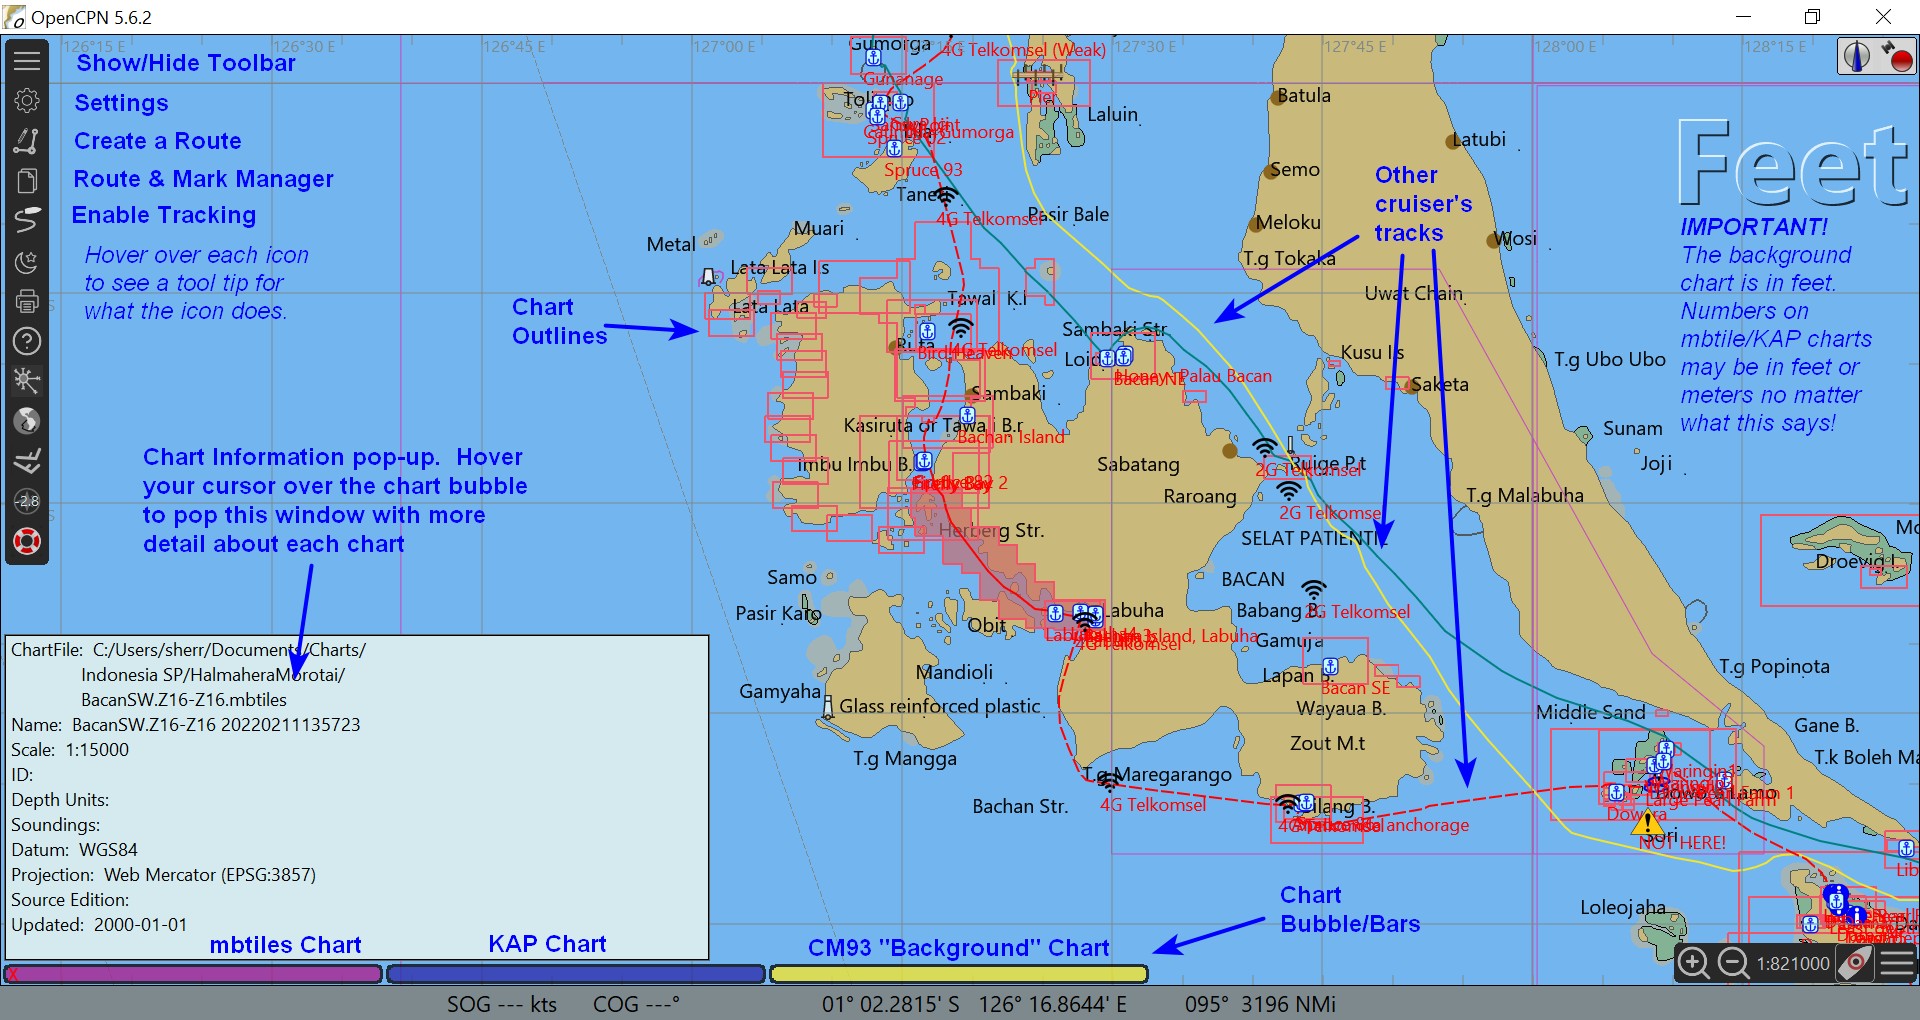
7. Make sure you have "show chart outlines" display option turned on. (shortcut: type "o" on the keyboard toggles show and hide chart outlines). You should then see red chart outlines for the areas of charts you have added.
You should also see Blue, Pink, and Yellow/Brown bubble/bars
at the bottom of the Chart area. These will change as you move the
chart around and zoom in and out. These designate the available charts
8. If you have 'chart quilting' turned on in OpenCPN, Play with the light
blue bars (KAP files) and pink bars (mbtiles) at the bottom of the screen to see which level of chart you can
choose. The left-most buttons on the bottom of the chart table are the
most detailed charts, and the right-most are the least detailed.
To zoom in and out, the easiest way is with the + and - keys on your
keyboard.
Download FREE OpenCPN Open Source Chart Plotter / Navigator
Here's where to find the "Background Chart" (CM93 world chart set)
Easy Steps to Make Your Own Satellite Chart
What is NordVPN? NordVPN is a leading virtual
private network (VPN) service that secures your internet connection by
encrypting online traffic and hiding your real IP address. It ensures online
privacy, enables access to geo-restricted content, and protects data on
public Wi-Fi.
Get
3 months free.
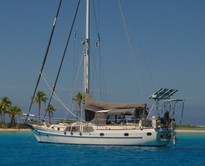
The New Soggy Paws in Raja Ampat June 2016